Qube now has a framework for collecting, reporting, and displaying various system performance metrics, collectively referred to as "Online Performance Reports".


This framework has four main components:
The System Metrics Collectors
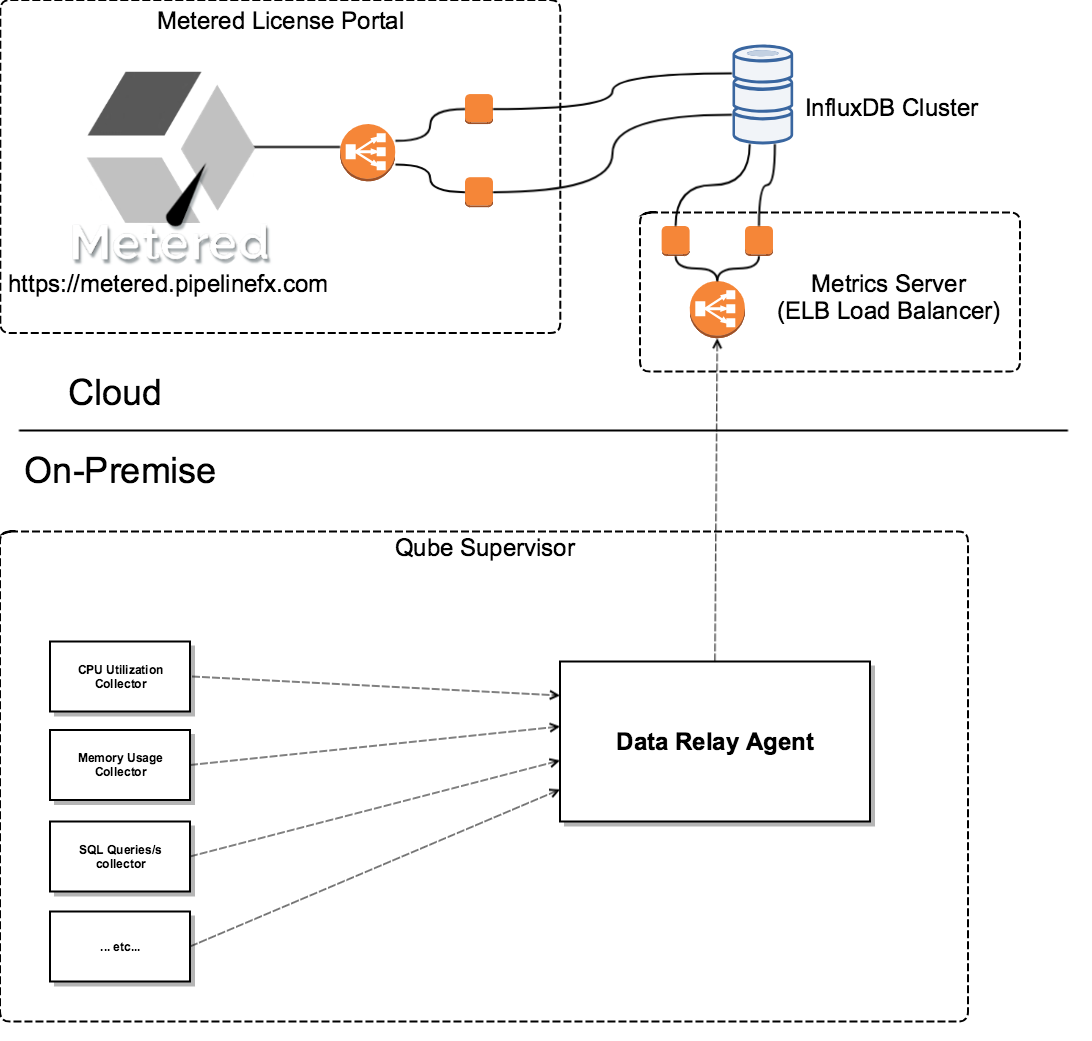
The metrics collectors run on the supervisor, one collector for each metric. They sample at 15-second intervals and report the data every 60 seconds to the Data Relay Agent (DRA). Data is sent over the HTTP protocol to the DRA.
Installation
The system metrics collectors are installed as part of the qube-system-metrics package; no post-installation configuration is necessary. They should begin running immediately after installation, check the metrics log for any messages relating to error conditions.
Logging
The system metrics collectors log location is platform-dependent:
- Linux: /var/spool/qube/metrics.log
- Windows (when available): C:\ProgramData\pfx\qube\metrics.log
- OS X (when available): /var/spool/qube/metrics.log
Configuration (Linux only)
Configuration is only needed when the DRA is not running on the supervisor host (the same host as the collectors), or is listening on a port other than its default of 5001. Configuration is done through 2 environment variables:
PFX_DRA_SERVER: defaults to 'localhost'PFX_DRA_PORT: defaults to 5001
These 2 environment variables are set by editing /etc/sysconfig/pfx_metrics and restarting the pfx-system-metrics service.
cat /etc/sysconfig/pfx_metrics
#PFX_DRA_SERVER=127.0.0.1
#PFX_DRA_PORT=5001
The Data Relay Agent (DRA)
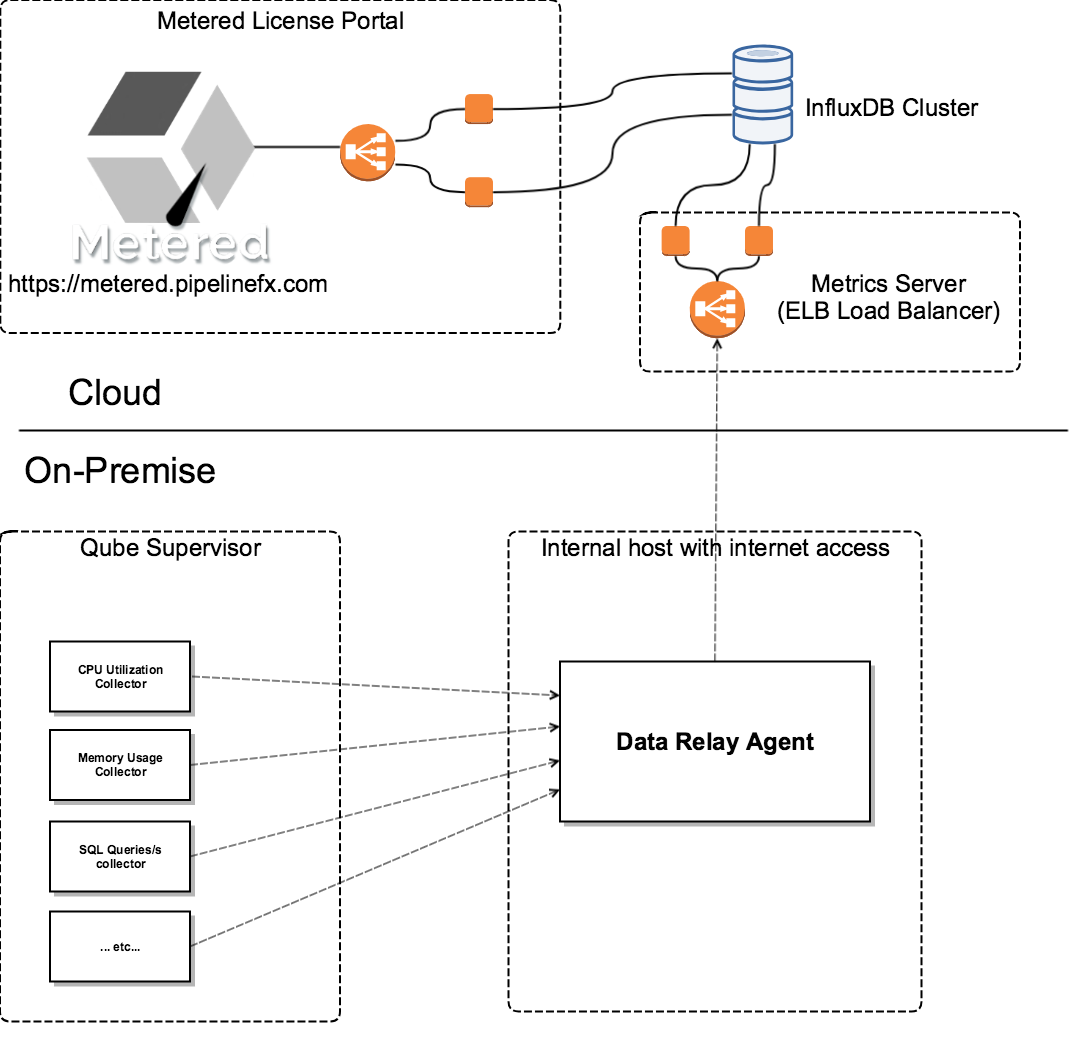
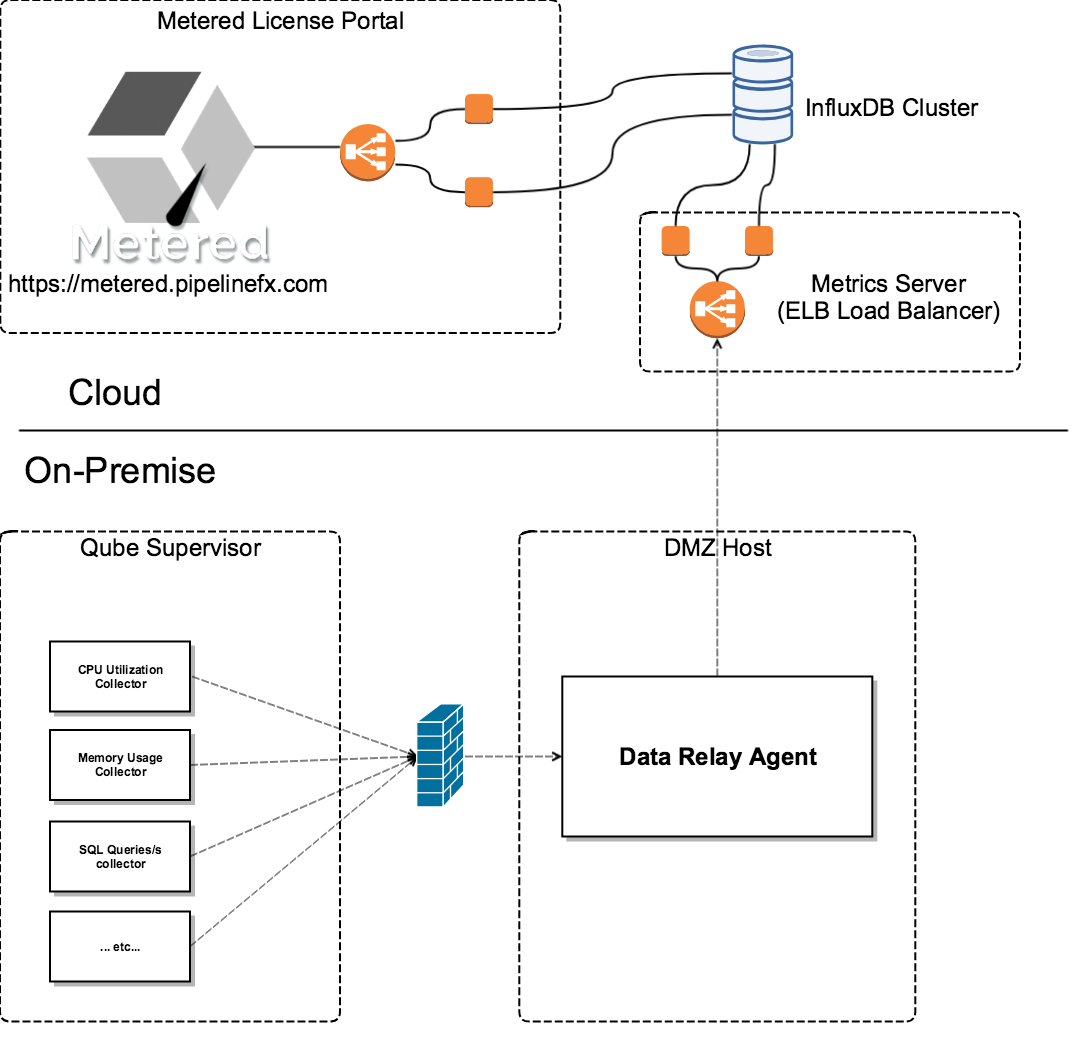
The DRA serves as a gateway between the collectors and the cloud-based metrics server. It can be installed either on the supervisor, on another host on the same network, or on a host outside of a firewall.
Logging
The DRA log
location is platform-dependent:
- Linux: /var/log/messages/dralog
- Windows (when available): C:\ProgramData\pfx\qube\metrics.log
- OS X (when available): /var/log/messages/dralog
Configuration
No configuration of the DRA is necessary for it to function as a gateway for the systems performance metrics.
Ports in use
The DRA listens for data from the system metrics collectors on port 5001.
DRA Installation Scenarios
Installed on the supervisor

Installed on another host on the internal network

Installed on a DMZ host

The Metrics Server
The DRA relays data up to the metrics server over a REST API running over TLS. The metrics server's only purpose is to ingest the metrics data and store it in an InfluxDB cluster database, and is a service running behind an Elastic Load Balancer to ensure high availability and scalability.
The Metered Licensing Portal
The metered license portal is the service running at https://metered.pipelinefx.com, and is a cluster of hosts behind an Elastic Load Balancer. The website servers behind that load balancer communicate with another set of backend servers behind a separate load balancer over another REST API, and those backend servers retrieve the metrics data from the InfluxDB cluster for display on the portal site.